AI-Backbone
You have seen a stat like this before. Somebody posts a win rate, it looks like free money, and a week later you have done nothing with it. That was us too, until one of them took thirty minutes to test.
Here is the one you may have scrolled past.
When London closes green on $NQ, New York closes green 78% of the time over the last three years.
That is from @edgeful, and it is a genuinely good post. The idea behind it fits in one line: let the session that has already finished tell you which way to lean in the session about to start. London trades. London closes. You check one thing, green or red. That is your bias for New York.
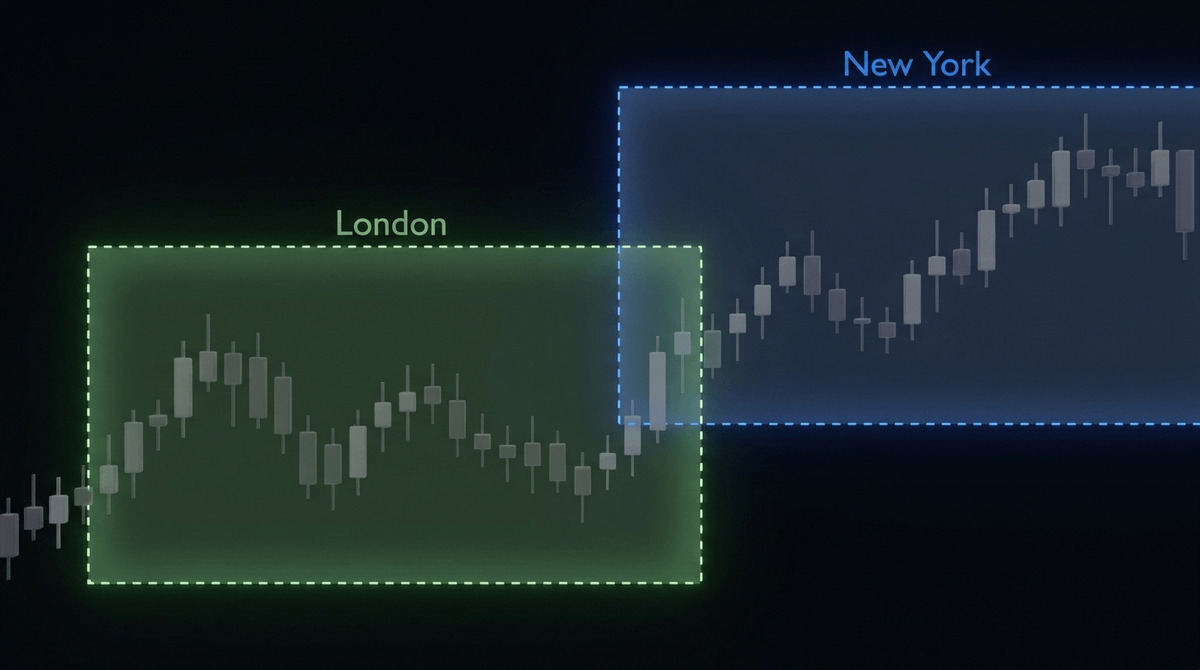
Two boxes, one question: does the green one predict the blue one? Image from the original post.
What A Win Rate Does Not Tell You
78% is a hit rate. A hit rate is not money.
It does not tell you when to get in. Or where to put your stop. Or when to get out. Change any one of those three and the same 78% ends up as a completely different number in your account.
Credit to the edgeful team, because they say exactly that themselves. They went back and measured it again, the way you would actually have to trade it. That is more care than most people take with a number that is already getting attention, and it is the reason their post was worth acting on rather than just liking.
Their work is on the Nasdaq. We trade Gold. A stat from one instrument owes you nothing on another, so there was only one way to find out.
What you actually need to know: a win rate tells you which way to lean. Your stop and your exit tell you what you get paid. The post gives you the first half, and it is a good first half. We built the second.
The Whole Prompt Was Two Lines
We did not write out the rules. We did not know them yet. We handed over the link:
read this post and build the strategy. https://x.com/edgeful/status/2095653322724343888
It read the post, worked out the rules the post implies, wrote the strategy, and ran it on Gold. That is the half hour.
What Two Years On Gold Actually Paid
$2,125 in profit. A maximum drawdown of −$434. That is the whole answer, and the ratio between those two numbers is the reason this one is easy to hold.
Two years of Gold. Minimal risk, minimal stress.
Now look at how it gets there. One trade opens each day at 12:00 UTC. Only one. Then it is done with you.
If the first thing you touch in the morning is your phone with MT5 on it, this strategy cures that habit.
One entry per day, always at 12:00 UTC.
Four things from the statistics are worth your attention:
- Four losses in a row, at worst. You get the source code, so you can size up after the third loss if that suits you.
- −$434 maximum drawdown against $2,125 of profit, across two years.
- The wins are bigger than the losses. That is what carries a win rate of roughly 50%.
- Some trades run longer than a day, so the strategy sometimes holds two or more positions at once.
Profit, drawdown, consecutive losses and the distribution of results.
And here is the part nobody selling you a bot will put in writing: this is a two-year backtest, not a live track record. We are not asking you to believe our numbers. We are handing you the code that produced them, so you can run the test yourself, on your instrument, and read every line that made it.
Take The Code
If you are done buying black boxes, or done grinding it out manually, this is the move: take the source code and use it to build strategies you understand, control, and can fix when the market changes.
Why free? Because a strategy you can read is the opposite of what you have been sold so far, and that is easier to show you than to explain.
Download source code and configuration Free · sent to your inbox
And go read edgeful.com while you are at it. They do the part most people skip, which is checking whether the setup actually works before anyone trades it.
P.S. The stat that started this took one post to read and thirty minutes to test. The next idea you scroll past this week is worth the same half hour, if you have something to test it with.